In Parts 1 and 2, we explored our system architecture and data partitioning strategies. Today, we’ll dive deep into how we managed memory using Apache Ignite to handle 2.5 million events per second while maintaining sub-millisecond response times.
Memory Management Challenges
Scale Requirements
-
Event Processing
- 2.5M events/second ingestion
- Sub-millisecond query latency
- Real-time aggregations
- State maintenance
-
DPI Data
- 350GB/15min processing
- Complex analysis
- Pattern detection
- Historical queries
-
Active Dataset
- Multiple event types
- Rich subscriber data
- Location information
- Real-time metrics
Memory Architecture

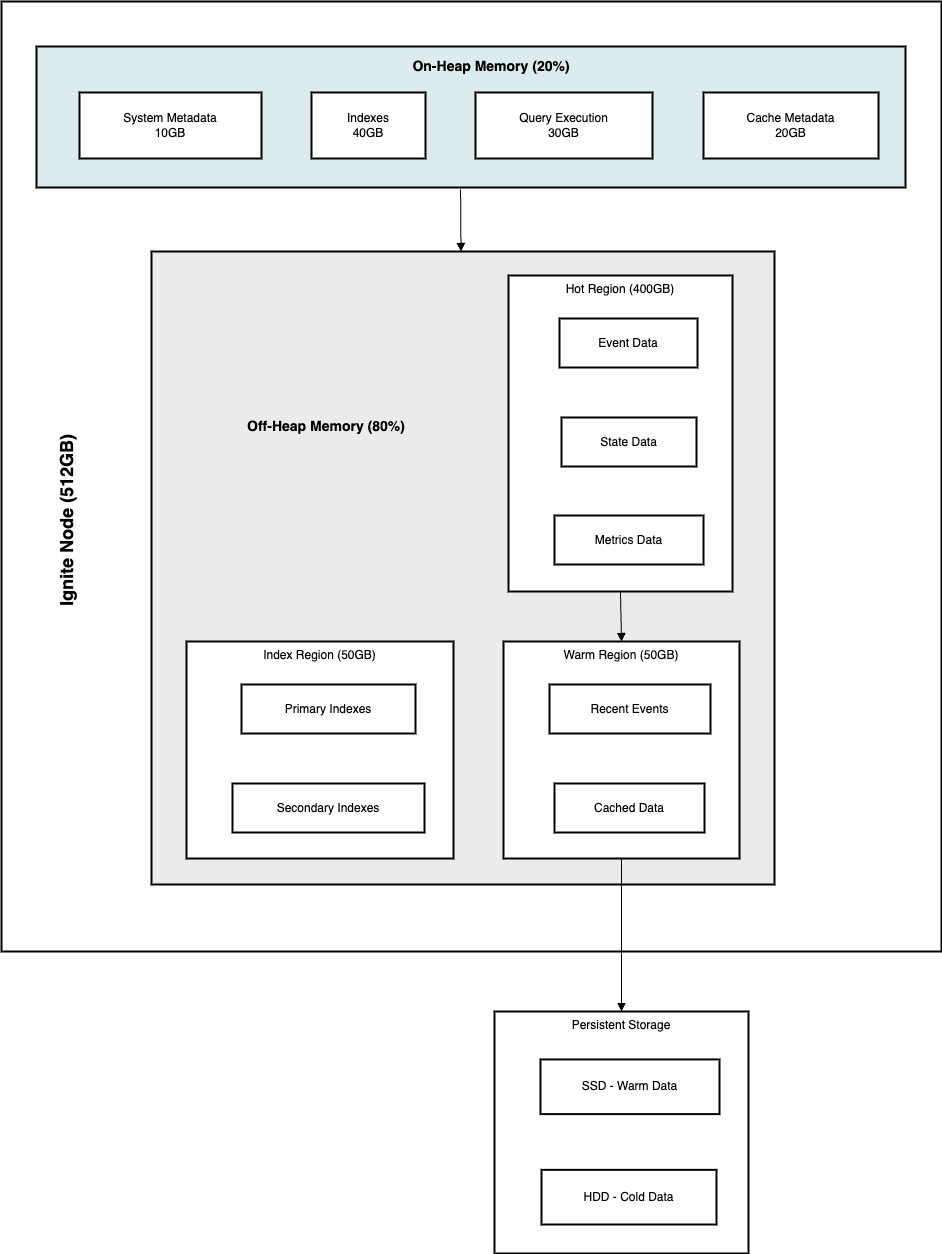
Memory Regions
-
On-Heap Memory (20%)
- Size: ~100GB per node
- Usage: Critical metadata
- Contents: Indexes and query execution
- GC tuning: ZGC optimized
-
Off-Heap Memory (80%)
- Size: ~400GB per node
- Usage: Event data storage
- Direct memory allocation
- Zero-copy operations
Memory Organization
-
Page Memory
- Page size: 2KB to 2MB
- Pre-allocated pools
- NUMA-aware allocation
- Defragmentation support
-
Data Regions
- Hot data region (4 hours)
- Warm data region (24 hours)
- Index region (permanent)
- System region (permanent)
Implementation Strategy

Memory Configuration
<bean class="org.apache.ignite.configuration.IgniteConfiguration">
    <property name="dataStorageConfiguration">
        <bean class="org.apache.ignite.configuration.DataStorageConfiguration">
            <!-- System region configuration -->
            <property name="systemRegionInitialSize"
                      value="#{10L * 1024 * 1024 * 1024}" /> <!-- 10GB -->

            <!-- Default region configuration -->
            <property name="defaultDataRegionConfiguration">
                <bean class="org.apache.ignite.configuration.DataRegionConfiguration">
                    <property name="name" value="Default_Region"/>
                    <property name="initialSize"
                              value="#{20L * 1024 * 1024 * 1024}" /> <!-- 20GB -->
                    <property name="maxSize"
                              value="#{50L * 1024 * 1024 * 1024}" /> <!-- 50GB -->
                    <property name="pageEvictionMode"
                              value="RANDOM_2_LRU"/>
                    <property name="metricsEnabled" value="true"/>
                </bean>
            </property>

            <!-- Custom regions configuration -->
            <property name="dataRegionConfigurations">
                <list>
                    <!-- Hot data region -->
                    <bean class="org.apache.ignite.configuration.DataRegionConfiguration">
                        <property name="name" value="Hot_Region"/>
                        <property name="initialSize"
                                  value="#{200L * 1024 * 1024 * 1024}" /> <!-- 200GB -->
                        <property name="maxSize"
                                  value="#{400L * 1024 * 1024 * 1024}" /> <!-- 400GB -->
                        <property name="pageEvictionMode"
                                  value="RANDOM_2_LRU"/>
                        <property name="evictionThreshold" value="0.95"/>
                        <property name="metricsEnabled" value="true"/>
                    </bean>

                    <!-- Index region -->
                    <bean class="org.apache.ignite.configuration.DataRegionConfiguration">
                        <property name="name" value="Index_Region"/>
                        <property name="initialSize"
                                  value="#{50L * 1024 * 1024 * 1024}" /> <!-- 50GB -->
                        <property name="maxSize"
                                  value="#{100L * 1024 * 1024 * 1024}" /> <!-- 100GB -->
                        <property name="persistenceEnabled" value="true"/>
                    </bean>
                </list>
            </property>
        </bean>
    </property>
</bean>
Memory Manager Implementation
public class CustomMemoryManager {
    private final IgniteCache<String, BinaryObject> cache;
    private final EvictionPolicy evictionPolicy;
    private final MetricsRegistry metricsRegistry;

    // Memory pressure handling
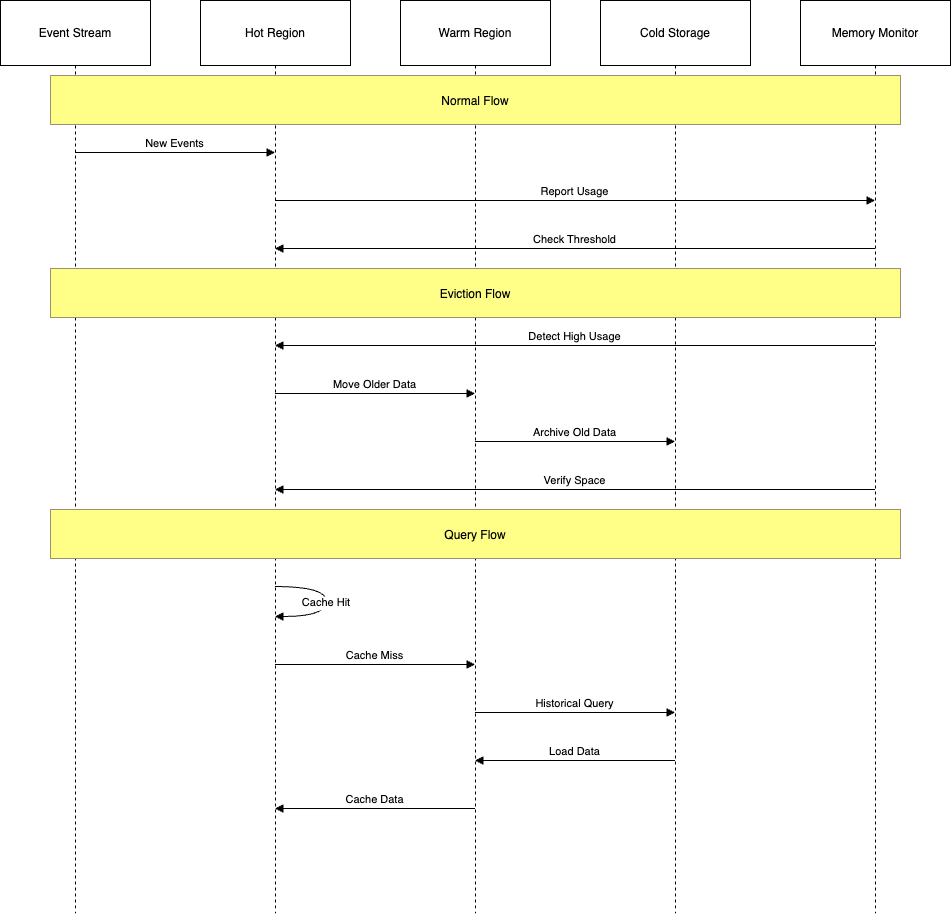
    public void handleMemoryPressure() {
        DataRegionMetrics metrics = getRegionMetrics("Hot_Region");
        double usagePercentage = metrics.getPagesFillFactor();

        if (usagePercentage > 0.9) { // 90% threshold
            triggerEviction();
        }
    }

    // Custom eviction logic
    private void triggerEviction() {
        // Get events older than 4 hours
        long cutoffTime = System.currentTimeMillis() -
            TimeUnit.HOURS.toMillis(4);

        SqlQuery<String, BinaryObject> query = new SqlQuery<>(
            Event.class, "timestamp < ? ORDER BY timestamp ASC LIMIT 10000");

        try (QueryCursor<Cache.Entry<String, BinaryObject>> cursor =
                cache.query(query.setArgs(cutoffTime))) {

            for (Cache.Entry<String, BinaryObject> entry : cursor) {
                // Move to warm storage
                moveToWarmStorage(entry.getKey(), entry.getValue());
                // Remove from hot storage
                cache.remove(entry.getKey());
            }
        }
    }

    // Warm storage management
    private void moveToWarmStorage(String key, BinaryObject value) {
        // Compress if needed
        byte[] compressed = compress(value);
        // Store in Cassandra
        cassandraTemplate.execute(
            "INSERT INTO warm_storage (key, data) VALUES (?, ?)",
            key, compressed);
    }
}
Memory Optimization Techniques
1. Data Layout Optimization
Object Structure Design
// Before Optimization
public class EventData {
    private String id;                     // 8 bytes reference
    private long timestamp;                // 8 bytes
    private String eventType;              // 8 bytes reference
    private Map<String, String> metadata;  // 8 bytes reference + overhead
    private byte[] payload;                // 8 bytes reference + data
}

// After Optimization
public class OptimizedEventData {
    private long id;          // 8 bytes (converted from String)
    private long timestamp;   // 8 bytes
    private byte eventType;   // 1 byte (enum converted to byte)
    private short metaCount;  // 2 bytes
    private byte[] combined;  // metadata + payload combined
}
Memory Alignment
public class AlignedEventData {
    // Fields arranged by size (descending) for optimal packing
    private long timestamp;      // 8 bytes
    private long id;            // 8 bytes
    private int dataLength;     // 4 bytes
    private short flags;        // 2 bytes
    private byte eventType;     // 1 byte
    private byte reserved;      // 1 byte (padding for 8-byte alignment)
    private byte[] data;        // aligned access
}
Object Pooling Implementation
public class EventObjectPool {
    private final Queue<EventData> pool;
    private final int maxPoolSize;

    public EventObjectPool(int maxSize) {
        this.pool = new ConcurrentLinkedQueue<>();
        this.maxPoolSize = maxSize;
    }

    public EventData acquire() {
        EventData event = pool.poll();
        if (event == null) {
            event = new EventData();
        }
        return event;
    }

    public void release(EventData event) {
        event.reset(); // Clear sensitive data
        if (pool.size() < maxPoolSize) {
            pool.offer(event);
        }
    }
}
2. Access Pattern Optimization
NUMA-Aware Allocation
public class NumaAwareAllocation {
    private final int[] numaNodes;
    private final ThreadLocal<Integer> nodeAffinity;

    public void allocateMemory(int size) {
        int node = nodeAffinity.get();
        // Allocate memory on specific NUMA node
        long address = unsafe.allocateMemory(size);
        // Bind memory to NUMA node
        numaBindMemory(address, size, node);
    }

    private native void numaBindMemory(long address, int size, int node);
}
Thread Affinity
public class ThreadAffinityManager {
    private final ConcurrentMap<Thread, Integer> threadToCore;
    private final int[] availableCores;

    public void setThreadAffinity() {
        Thread currentThread = Thread.currentThread();
        int core = threadToCore.get(currentThread);

        // Set processor affinity
        setThreadAffinityMask(1L << core);
    }

    private native void setThreadAffinityMask(long mask);
}
Cache Line Optimization
public class CacheLineAligned {
    private static final int CACHE_LINE = 64; // bytes

    // Prevent false sharing with padding
    @sun.misc.Contended
    private volatile long counter;

    // Ensure cache line alignment
    private long padding1, padding2, padding3, padding4,
                padding5, padding6, padding7;
}
3. Memory Access Patterns
Sequential Access
public class SequentialAccessBuffer {
    private final ByteBuffer buffer;
    private final int blockSize;

    public void processData() {
        // Sequential read is faster than random access
        for (int i = 0; i < buffer.capacity(); i += blockSize) {
            buffer.position(i);
            processBlock(buffer, blockSize);
        }
    }
}
Batch Processing
public class BatchProcessor {
    private static final int BATCH_SIZE = 1000;

    public void processBatch(List<Event> events) {
        // Process events in batches to improve memory access patterns
        for (int i = 0; i < events.size(); i += BATCH_SIZE) {
            int end = Math.min(i + BATCH_SIZE, events.size());
            List<Event> batch = events.subList(i, end);
            processEventBatch(batch);
        }
    }
}
Eviction Strategies

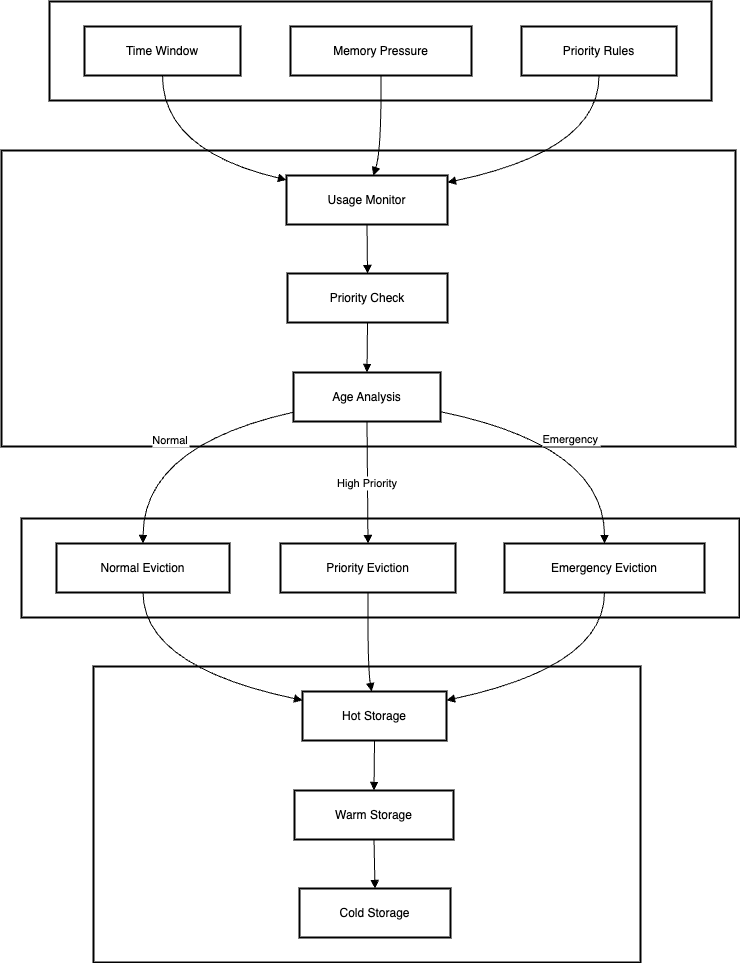
1. Time-Based Eviction
Rolling Window Implementation
public class TimeBasedEviction {
    private final Duration windowSize;
    private final EvictionQueue<TimedEntry> queue;

    public void evictExpired() {
        long cutoff = System.currentTimeMillis() - windowSize.toMillis();

        while (!queue.isEmpty() &&
               queue.peek().getTimestamp() < cutoff) {
            TimedEntry entry = queue.poll();
            processEviction(entry);
        }
    }

    private void processEviction(TimedEntry entry) {
        // Move to appropriate storage tier
        if (entry.isHot()) {
            moveToWarmStorage(entry);
        } else {
            moveToColdStorage(entry);
        }
    }
}
Priority-Based Time Eviction
public class PriorityTimeEviction {
    private final PriorityQueue<EventData> priorityQueue;
    private final Map<String, Integer> customerTiers;

    public void evictWithPriority() {
        long currentTime = System.currentTimeMillis();

        while (needsEviction()) {
            EventData event = priorityQueue.peek();
            if (shouldEvict(event, currentTime)) {
                event = priorityQueue.poll();
                evictEvent(event);
            } else {
                break;
            }
        }
    }

    private boolean shouldEvict(EventData event, long currentTime) {
        int tier = customerTiers.getOrDefault(event.getCustomerId(), 0);
        long age = currentTime - event.getTimestamp();

        // Higher tier customers get longer retention
        return age > getRetentionPeriod(tier);
    }
}
2. Size-Based Eviction
Memory Threshold Management
public class MemoryThresholdEviction {
    private static final double WARNING_THRESHOLD = 0.80;
    private static final double CRITICAL_THRESHOLD = 0.90;

    private final MemoryUsageMonitor monitor;
    private final EvictionPolicy policy;

    public void checkAndEvict() {
        double usage = monitor.getCurrentUsage();

        if (usage >= CRITICAL_THRESHOLD) {
            // Aggressive eviction
            policy.criticalEviction();
        } else if (usage >= WARNING_THRESHOLD) {
            // Normal eviction
            policy.normalEviction();
        }
    }
}
Back-pressure Implementation
public class BackPressureManager {
    private final AtomicDouble memoryUsage;
    private final BlockingQueue<Event> inputQueue;

    public void applyBackPressure(Event event) {
        double usage = memoryUsage.get();

        if (usage > 0.95) {
            // Reject new events
            throw new MemoryPressureException("Memory full");
        } else if (usage > 0.85) {
            // Add with timeout
            boolean added = inputQueue.offer(event,
                100, TimeUnit.MILLISECONDS);
            if (!added) {
                handleRejection(event);
            }
        } else {
            // Normal processing
            inputQueue.add(event);
        }
    }
}
Batch Eviction Control
public class BatchEvictionController {
    private static final int MAX_BATCH_SIZE = 10000;
    private final EvictionQueue queue;

    public void evictBatch() {
        List<QueueEntry> batch = new ArrayList<>();
        int currentSize = 0;

        while (currentSize < MAX_BATCH_SIZE && !queue.isEmpty()) {
            QueueEntry entry = queue.poll();
            batch.add(entry);
            currentSize += entry.getSize();
        }

        if (!batch.isEmpty()) {
            processBatchEviction(batch);
        }
    }
}
Monitoring and Alerting
Memory Metrics
-
Usage Metrics
- Region utilization
- Page allocation rates
- Eviction statistics
- GC performance
-
Performance Metrics
- Access latencies
- Hit/miss ratios
- Throughput rates
- Queue depths
Alert Thresholds
-
Critical Alerts
- Memory usage > 90%
- GC pause > 500ms
- Eviction rate spike
- Error rate increase
-
Warning Alerts
- Memory usage > 80%
- GC pause > 200ms
- Queue depth increase
- Throughput drop
Performance Results
Latency Profile
- Read operations: < 1ms (p99)
- Write operations: < 2ms (p99)
- Query operations: < 10ms (p99)
- Scan operations: < 100ms (p99)
Throughput Achievements
- Event processing: 2.5M/second
- Query processing: 100K/second
- Scan processing: 10K/second
- Background operations: 1K/second
Lessons Learned
1. Memory Architecture Design
Initial Planning
- Start Conservative: Begin with smaller memory regions and scale up based on actual usage patterns
- Measure Everything: Implement comprehensive memory monitoring before going live
- Plan for Growth: Design memory regions with at least 50% headroom for unexpected spikes
- Document Assumptions: Keep track of all memory sizing assumptions and validate them regularly
Real-world Insights
// Example of what not to do
public class PoorMemoryPlanning {
    // Don't hardcode memory sizes
    private static final long MEMORY_SIZE = 100 * 1024 * 1024; // 100MB fixed

    // Don't assume fixed event sizes
    private static final int EVENT_SIZE = 1024; // 1KB per event
}

// Better approach
public class AdaptiveMemoryPlanning {
    private final ConfigurationManager config;

    public long calculateMemorySize() {
        // Base size from configuration
        long baseSize = config.getBaseMemorySize();

        // Growth factor based on historical data
        double growthFactor = getHistoricalGrowthFactor();

        // Add safety margin
        return (long)(baseSize * growthFactor * 1.5);
    }
}
2. Performance Optimization
Memory Access Patterns
- Profile First: Always profile before optimizing
- Batch Operations: Batch similar operations for better cache utilization
- Avoid Premature Optimization: Start with simple, maintainable code and optimize based on data
- Test at Scale: Performance characteristics change dramatically at scale
Implementation Experience
// Common performance pitfall
public class IneffientProcessing {
    public void processEvents(List<Event> events) {
        // Don't process one at a time
        for (Event event : events) {
            processEvent(event);
            saveToDatabase(event);
            updateMetrics(event);
        }
    }
}

// Optimized approach
public class BatchProcessing {
    private static final int BATCH_SIZE = 1000;

    public void processEvents(List<Event> events) {
        // Process in batches
        for (List<Event> batch : Lists.partition(events, BATCH_SIZE)) {
            List<Event> processed = processEventBatch(batch);
            saveBatchToDatabase(processed);
            updateMetricsBatch(processed);
        }
    }
}
3. Operational Management
Monitoring and Alerting
- Define Clear Thresholds: Establish clear memory thresholds for different alert levels
- Implement Trending: Track memory usage patterns over time
- Set Up Early Warnings: Alert before reaching critical levels
- Keep Historical Data: Maintain historical memory usage data for capacity planning
Monitoring Implementation
public class MemoryMonitoring {
    private static final double WARNING_THRESHOLD = 0.75;
    private static final double CRITICAL_THRESHOLD = 0.90;

    public void monitorMemory() {
        // Track multiple metrics
        recordMemoryMetrics(
            getHeapUsage(),
            getOffHeapUsage(),
            getGCMetrics(),
            getEvictionRates()
        );

        // Monitor trends
        analyzeTrends();

        // Predict capacity needs
        predictCapacityNeeds();
    }

    private void analyzeTrends() {
        // Look at last 24 hours
        List<MemoryMetric> recent = getRecentMetrics(Duration.ofHours(24));

        // Calculate growth rate
        double growthRate = calculateGrowthRate(recent);

        // Predict when we'll hit thresholds
        predictThresholdBreach(growthRate);
    }
}
4. Team and Process
Knowledge Sharing
- Document Everything: Maintain detailed documentation of memory-related decisions
- Regular Reviews: Conduct regular reviews of memory usage patterns
- Share Insights: Create knowledge sharing sessions for the team
- Update Runbooks: Keep operational runbooks updated with learned lessons
Process Implementation
public class OperationalRunbook {
    public void handleMemoryPressure() {
        // Clear documentation of steps
        List<Action> actions = Arrays.asList(
            new Action("Check memory metrics"),
            new Action("Analyze GC logs"),
            new Action("Review recent changes"),
            new Action("Check eviction rates"),
            new Action("Verify backup systems")
        );

        // Execute and document each step
        for (Action action : actions) {
            executeAndDocument(action);
        }
    }
}
5. Capacity Planning
Resource Management
- Regular Review: Review memory usage patterns monthly
- Predictive Planning: Use trending data for capacity planning
- Cost Analysis: Balance memory usage with cost implications
- Growth Planning: Plan for both expected and unexpected growth
Planning Implementation
public class CapacityPlanner {
    public CapacityPlan createPlan() {
        return CapacityPlan.builder()
            .currentUsage(getCurrentUsage())
            .growthRate(calculateGrowthRate())
            .seasonalFactors(getSeasonalPatterns())
            .costImplications(analyzeCosts())
            .recommendedActions(generateRecommendations())
            .build();
    }

    private List<Recommendation> generateRecommendations() {
        List<Recommendation> recommendations = new ArrayList<>();

        // Memory sizing recommendations
        recommendations.add(analyzeMemorySizing());

        // Cost optimization recommendations
        recommendations.add(analyzeCostOptimizations());

        // Performance improvement recommendations
        recommendations.add(analyzePerformance());

        return recommendations;
    }
}
6. Technical Debt Management
Code Evolution
- Maintain Clean Code: Technical debt compounds quickly in memory management
- Regular Refactoring: Schedule regular refactoring sessions
- Performance Tests: Maintain comprehensive performance test suites
- Configuration Management: Keep configurations well-documented and versioned
Technical Debt Tracking
public class TechnicalDebtTracker {
    public void trackMemoryIssues() {
        // Track known issues
        List<TechnicalDebt> issues = Arrays.asList(
            new TechnicalDebt("Manual memory management in legacy code"),
            new TechnicalDebt("Outdated eviction policies"),
            new TechnicalDebt("Unoptimized object creation"),
            new TechnicalDebt("Missing memory metrics")
        );

        // Prioritize and plan resolution
        prioritizeIssues(issues);
        createResolutionPlan(issues);
    }
}
7. Future Considerations
Scalability Planning
- Architecture Reviews: Regular reviews of memory architecture
- Technology Updates: Keep track of new memory management features
- Performance Improvements: Continuous performance optimization
- Cost Optimization: Regular review of memory costs and benefits
Innovation Planning
public class FuturePlanning {
    public void planImprovements() {
        // Track potential improvements
        List<Improvement> improvements = Arrays.asList(
            new Improvement("Implement new GC algorithms"),
            new Improvement("Adopt newer memory management APIs"),
            new Improvement("Implement machine learning for prediction"),
            new Improvement("Automate capacity planning")
        );

        // Evaluate and prioritize
        evaluateImprovements(improvements);
        createImplementationPlan(improvements);
    }
}
These lessons learned have been critical in maintaining and improving our memory management system. They continue to guide our decisions and help us avoid common pitfalls in high-scale data processing systems.
Looking Ahead
In Part 4, we’ll explore how we optimized our Kafka infrastructure to handle the massive throughput requirements while ensuring reliable message delivery and processing.
Stay tuned to learn about our Kafka cluster design, configuration tuning, and operational practices.